Data Manipulation in R with dplyr
dplyr is an R package, a collection of functions and data sets that enhance the R language. First you will master the five verbs of R data manipulation with dplyr: select, mutate, filter, arrange and summarise. Next, you will learn how you can chain your dplyr operations using the pipe operator of the magrittr package. In the final section, the focus is on practicing how to subset your data using the group_by function, and how you can access data stored outside of R in a database. All said and done, you will be familiar with data manipulation tools and techniques that will allow you to efficiently manipulate data.
Introduction to dplyr and tbls
Introduction to the dplyr package and the tbl class. Meet the data structures that dplyr uses behind the scenes.
- Introduction to dplyr.
- Most datasets contain more information than they display; dplyr can help you to access that information, it contains a grammar of data manipulation, will help you find new variables, new observations and new ways to describe data. you'll learn to use dplyr's grammar of data manipulation to solve any data related task that you can think of.
- tbl. This is a new data structure for R. It is just a special type of data frame that will help you look at long data sets.
- To turn a data set into a tbl, you use tbl_df(). When you display this new format, it cuts out rows and column so that you get a look at its structure, dimesions and variables names (and their data type)
- glimpse(). To see a more complete display of the tbl data. It shows you the data types and the initial values of each column in the dataset
- Remarks.
- tbl doesn't change the data's underlying data structure, it inherits the original class of its input, a data.frame.
- You can always get back yo your original type of dataset with as.data.frame().
- tbl makes your data easier to work with.
- It is straightforward to derive a tbl from a data.frame structure using
as_tibble().
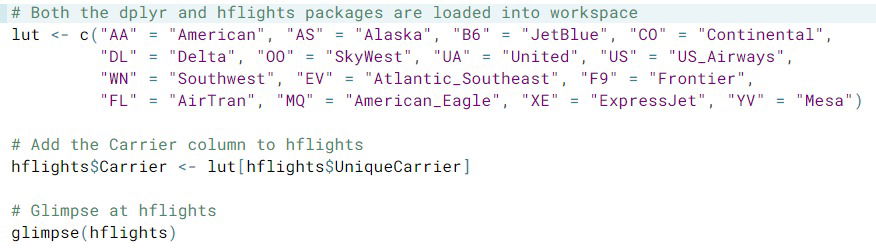
- Changing labels.
Meet the five verbs. The dplyr's gramma is built around five functions, or verbs, that do the basic tasks of data manipulation.
- Select. (For variables)Removes columns from a dataset.
- Filter. (For observations)Removes rows.
- Arrange.(For observations) Reorders the rows in a dataset.
- Mutate. (For variables)Uses the data to build new columns of values.
- Summarize. (For groups)Calculates summary statistics.
Each verb is simple by itself, but you can combine them to manipulate your data in sophisticated ways. The better these work is when your data comes in rows-observations, columns-variables, known as tidy data
- Obs.
- The "tidyr" package is designed to help you reorganize your data in a tidy layout
- You don't need to quote the variables names as you enter them in the function nor you have to used $-quotation... just use the given names in the tbl or df
- dplyr functions do not change the orginal dataset; they return a new copy for you to use
Select and mutate
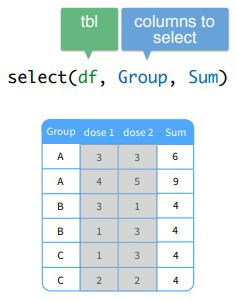
- select(). Removes columns from a dataset.To use this, give the function the name of a tbl or data frame, then columns to select.
- Fast selecting. You can also use
:to select a range of variables and-to exclude some variables, similar to indexing a data.frame with square brackets. You can use both variable's names as well as integer indexes. This call selects the four first variables except for the second one of a data framedf:select(df, 1:4, -2) - Helper functions.
dplyrcomes with a set of helper functions that can help you select groups of variables inside aselect()call:starts_with("X"): every name that starts with"X",ends_with("X"): every name that ends with"X",contains("X"): every name that contains"X",matches("X"): every name that matches"X", where"X"can be a regular expression,num_range("x", 1:5): the variables namedx01,x02,x03,x04andx05,one_of(x): every name that appears inx, which should be a character vector.
Pay attention here: When you refer to columns directly inside
select(), you don't use quotes. If you use the helper functions, you do use quotes.
- Fast selecting. You can also use
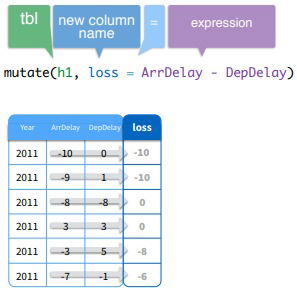
mutate(). Uses the data to build new columns of values, i.e, it reveals information that your data set already contains but does not display. To use it, enter the tbl name, then define the new variables that you'd like to create.
Add multiple variables. To create more than one variable, place a comma between each variable that you define inside
mutate().mutate()even allows you to use a new variable while creating a next variable in the same call. In this example, the new variablexis directly reused to create the new variabley:mutate(my_df, x = a + b, y = x + c)
Filter and Arrange
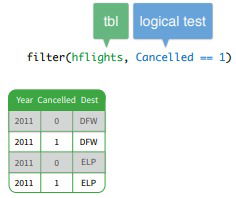
- filter(). Search through the observations in your dataset (and extract useful observations) with the filter function.
- Logical operators. R comes with a set of logical operators that you can use inside filter():
x < y, TRUE if x is less than y
x <= y, TRUE if x is less than or equal to y
x == y, TRUE if x equals y
x != y, TRUE if x does not equal y
x >= y, TRUE if x is greater than or equal to y
x > y, TRUE if x is greater than y
x %in% c(a, b, c), TRUE if x is in the vector c(a, b, c) - Obs.
- We have &,|,! operators.
- Instead of using the & operator, you can also pass several logical tests to filter(), separated by commas.
- Ex.
- Add a new column named Date to c1: paste() together the Year, Month and DayofMonth variables, separate them by a "-" by using the sep attribute of paste(). Save the resulting data frame as c2.
- Logical operators. R comes with a set of logical operators that you can use inside filter():
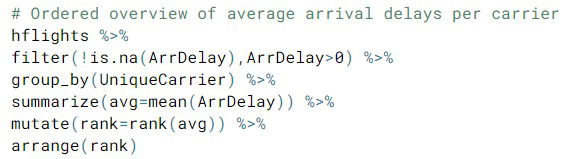
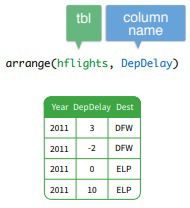
- arrange(). Reorders the rows in a dataset based on its variables (or based on sums of your variables for ex.). If you pass severable variables it serves to untie observations.
- Obs.
- The default way to arrange is increasing. If you want it decreasing you just wrap your variable name, desc(var_name).
- If you pass arrange() a character variable, for example, R will rearrange the rows in alphabetical order according to values of the variable. If you pass a factor variable, R will rearrange the rows according to the order of the levels in your factor (running levels() on the variable reveals this order).
- Obs.
Summarize and the pipe operator
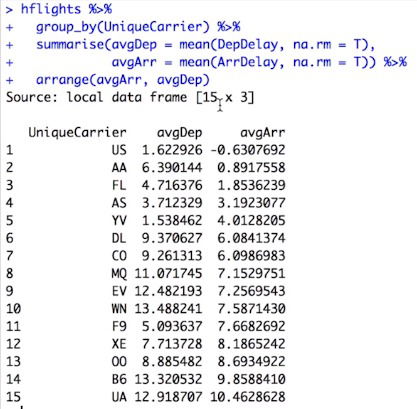
- summarize(). Calculates summary statistics.
- s
- You can use any function you like in
summarize()so long as the function can take a vector of data and return a single number. R contains many aggregating functions, asdplyrcalls them:min(x)- minimum value of vectorx.max(x)- maximum value of vectorx.mean(x)- mean value of vectorx.median(x)- median value of vectorx.quantile(x, p)-pth quantile of vectorx.sd(x)- standard deviation of vectorx.var(x)- variance of vectorx.IQR(x)- Inter Quartile Range (IQR) of vectorx.diff(range(x))- total range of vectorx.
- Other helpful aggregate functions include:
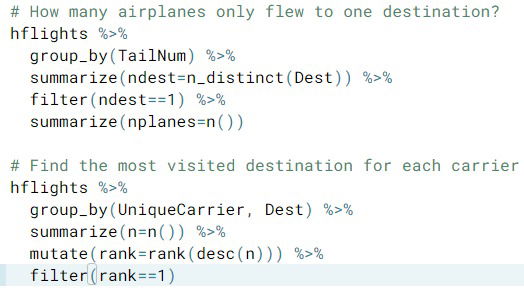
first(x)- The first element of vectorx.last(x)- The last element of vectorx.nth(x, n)- Thenth element of vectorx.n()- The number of rows in the data.frame or group of observations thatsummarize()describes.n_distinct(x)- The number of unique values in vectorx.
- The pipe operator. It comes from the magrittr package (and it's directly imported from dplyr)
- For an easy use to chain functions we have the pipe operator. Is an operator that you place between an object and a function. It is really easy to read if you pronounce the pipe character as "then".
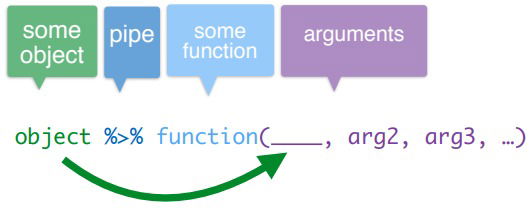
- What to avoid: You can use temporary variables and pass each to a new verb function (Slowing down your analysis), or you can avoid passing objects between functions by chaining your functions directly together (Difficult to read).
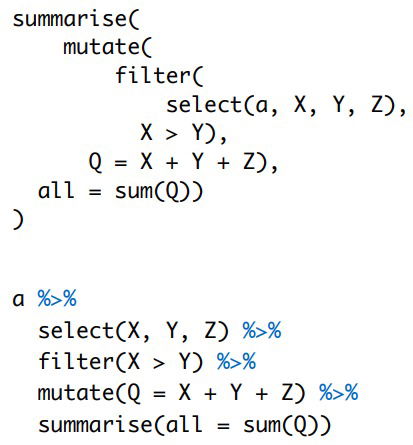
- For an easy use to chain functions we have the pipe operator. Is an operator that you place between an object and a function. It is really easy to read if you pronounce the pipe character as "then".
Group_by and working with databases
Learn to use group_by to group your data into subsets of observations, and use dplyr to access data stored outside of R in a database.
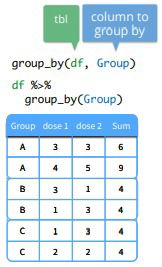
- group_by(). We want to make observations about groups of rows within the dataset. This function groups a data frame or tbl by the values of a variable in the dataset
- Databases. With dplyr you can manipulate any structure like data frame, data table or database; that is, any of mutate(), select(), group_by(), etc have methods to manipulate these structures. You can convert a data table and a data base to tibble using tbl_dt() and tbl() respectively.
- Working with a data table
hflights2is a copy ofhflightsthat is saved as a data table using the following code:library(data.table) hflights2 <- as.data.table(hflights)
- Using a mySQL database. Although
nycflightsis a reference to data that lives outside of R, you can use thedplyrcommands on them as usual. Behind the scenes,dplyrwill convert the commands to the database's native language (in this case, SQL), and return the results. This allows you to pull data that is too large to fit in R: only the fraction of the data that you need will actually be downloaded into R, which will usually fit into R without memory issues.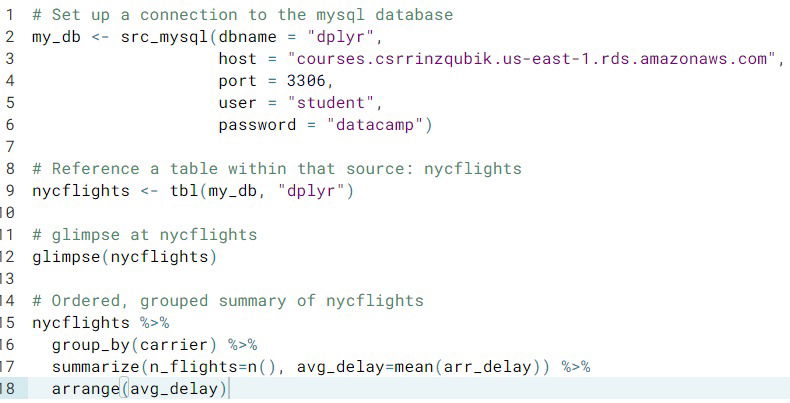
- Working with a data table