Visualizing Big Data with Trelliscope
General strategies for visualizing big data
- Visualizing summaries. First we find general high-level patterns by plotting distributions and summary statistics of each variable to gain a general understanding of the data before asking more detailed questions
- Adding more detail to summaries. We can introduce more variables into the summary computations.
- Binning tow or more contonuous variables to visualize joint distribution

- Grouping or faceting summary computations by additional variables
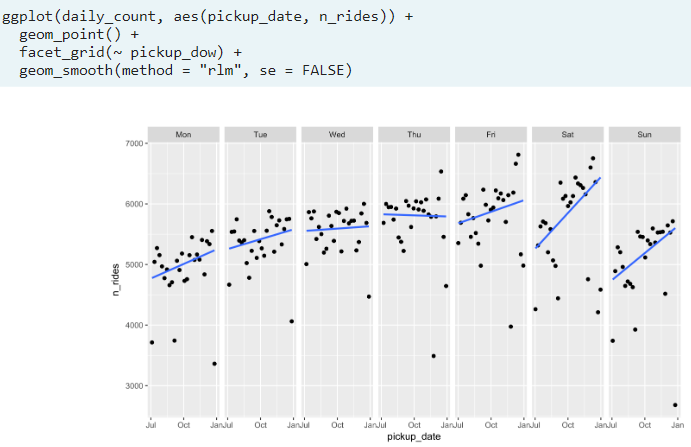
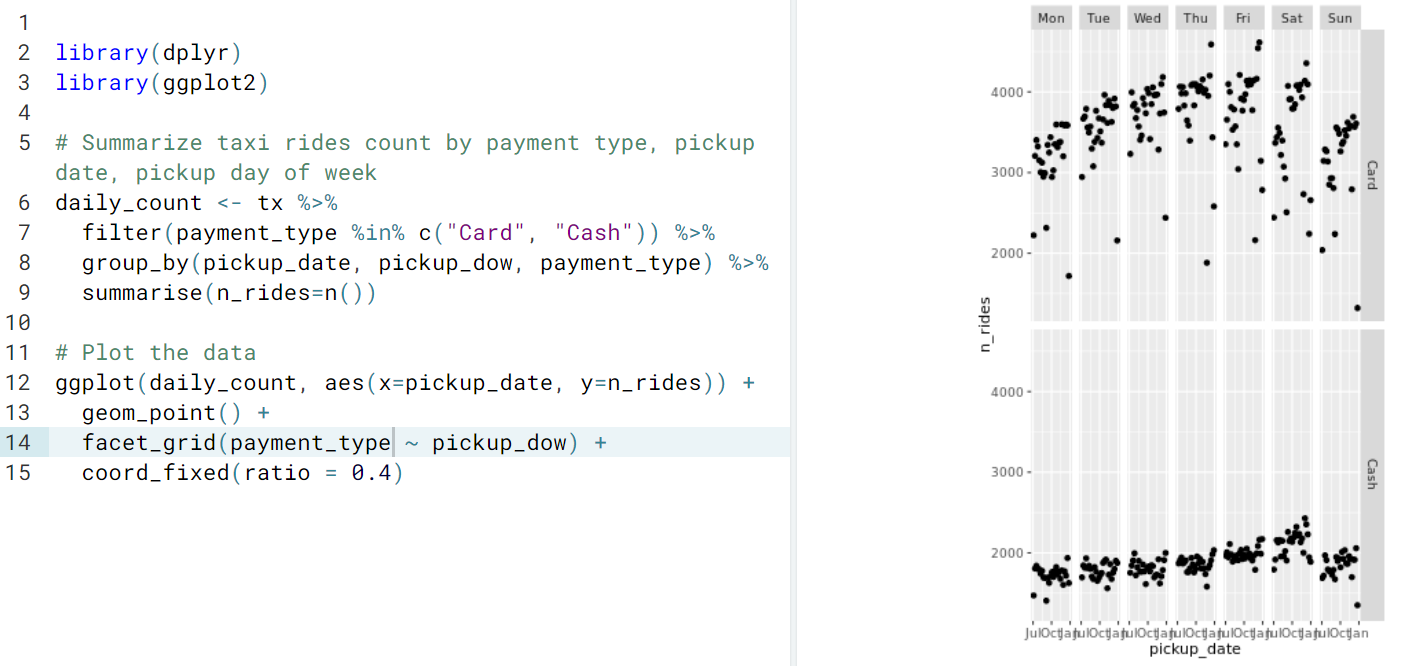
- Ex. Faceting daily rides. We noticed some interesting behavior when we looked at daily ride counts faceted by day-of-week. Let's investigate whether faceting on additional variables yields any new insights. Here we will see if there are different day-of-week patterns when also looking at the payment types of cash or credit card.
- Binning tow or more contonuous variables to visualize joint distribution
- Visualizing subsets. Sometimes, important details of our data are covered up (Iost) in summarization. In order to avoid this, we want detailed visualizations, which could be challenging due to big data, so one solution is to take a subset of the data that has a natural meaning by its own (e.g big data on multiple stocks, the a natural subset would be to select only one stock)
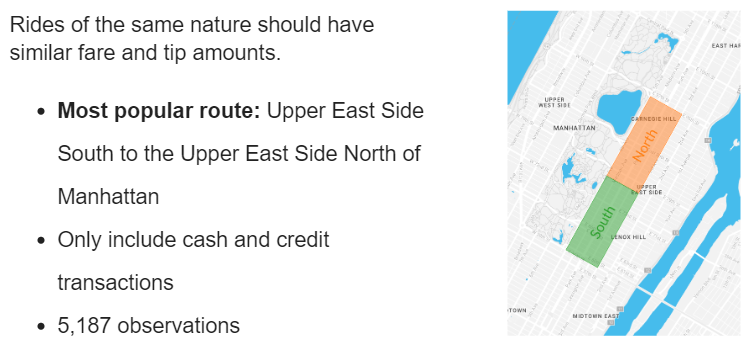
- Ex. In a previous exercise we saw that card-payment was the only one that included tip (cash did not). To investigate this: we'd expect rides of the same nature to have similar fare and tip amounts. So we pull a subset of our data of a specific route and for this one we compare the fare and tip amountThen we plot a quantile plot to see how the fare behaves for each payment method. As we can see the shape is similar but shifted which could suggest that the registered cash payment does not include tip. To confirm this we can substract tip to the card one and see if now they're both similar
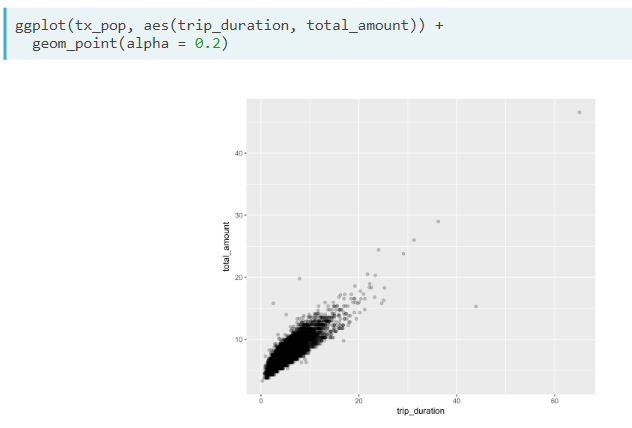 This plot shows that indeed, the route has similar fare amounts
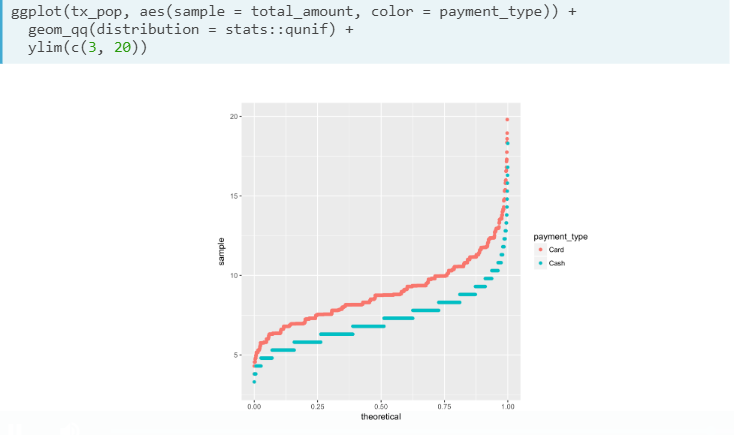
- Ex. In a previous exercise we saw that card-payment was the only one that included tip (cash did not). To investigate this: we'd expect rides of the same nature to have similar fare and tip amounts. So we pull a subset of our data of a specific route and for this one we compare the fare and tip amount
- Visualizing all subsets. When analyzing a specific subset of our data we gain interesting insights, without worrying about scalable visualization methods. However, in order to make conclusions for our whole dataset, it is sometimes impossible to repeat the process to all naturall subsets, which may be thousands. In the following chapter we will explore an approach to visualize larger datasets in detail through faceting with Trelliscope.
ggplot2 +TrelliscopeJS
Scalabe detailed visualization is easily achievable with an exciting new package, TrelliscopeJS
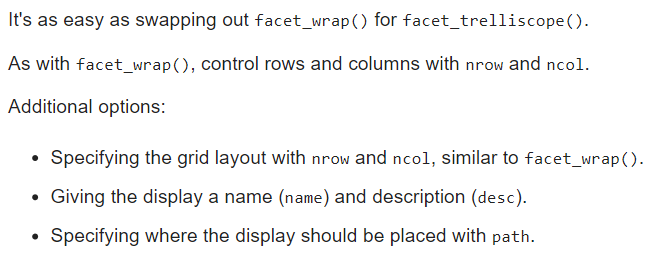
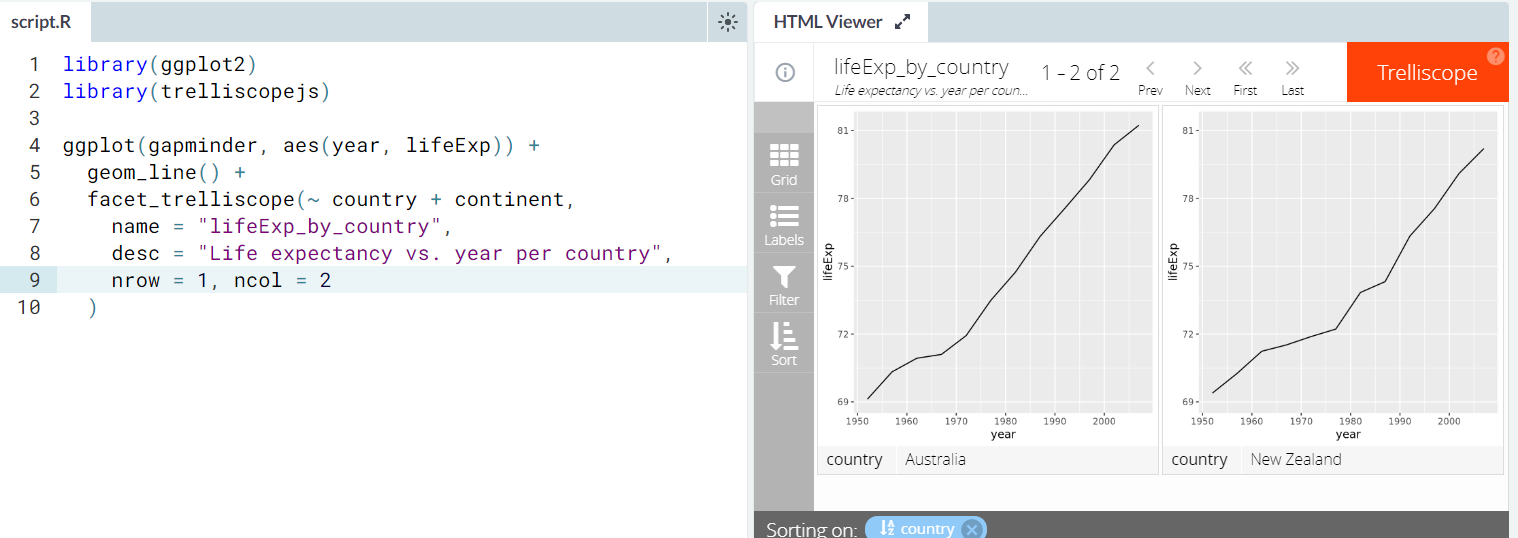
- Faceting with TrelliscopeJS. This will provide you with an interactive faceted display that shows a grid of plots with the ability to page through the plots if there are too many to fit on one page
- Ex.
- Ex.
- Interacting with the TrelliscopeJS displays
The display allows you to look at all of the panels of a visualizations at once, but allowing you to interactively page, sort, and filter the panels in a targeted way to help zero in on the most interesting spaces of a visualization. This allows Trelliscope JS to enable scalable faceting with potentially thousands of panels- Paging
- Grid layout
- Labels
- Filtering
- Sorting
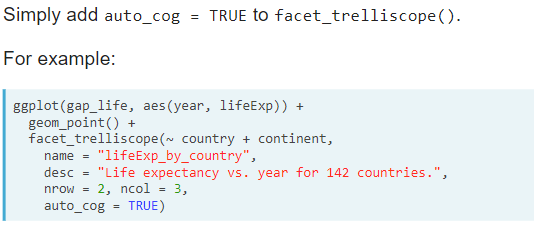
- Additional features. We can easily add interactivity inside our ggpplot2 panels, compute cognostics automatically in context of what is being plotted, and set axis limit ranges with a few commands.
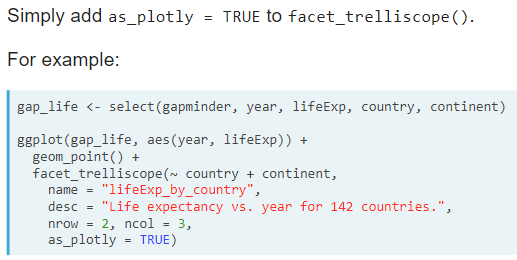
- Using Plotly. This uses the plotly R package to transform your ggplot2 panels into interactive plotly graphics. With hardly any effort we have features like tooltips and zooming for free.
 as_plotly may not always be compatible with the type of plot you're making
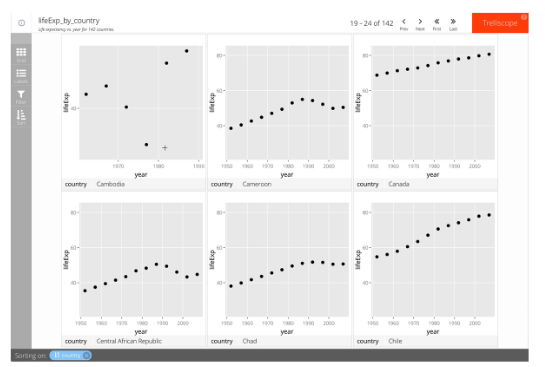
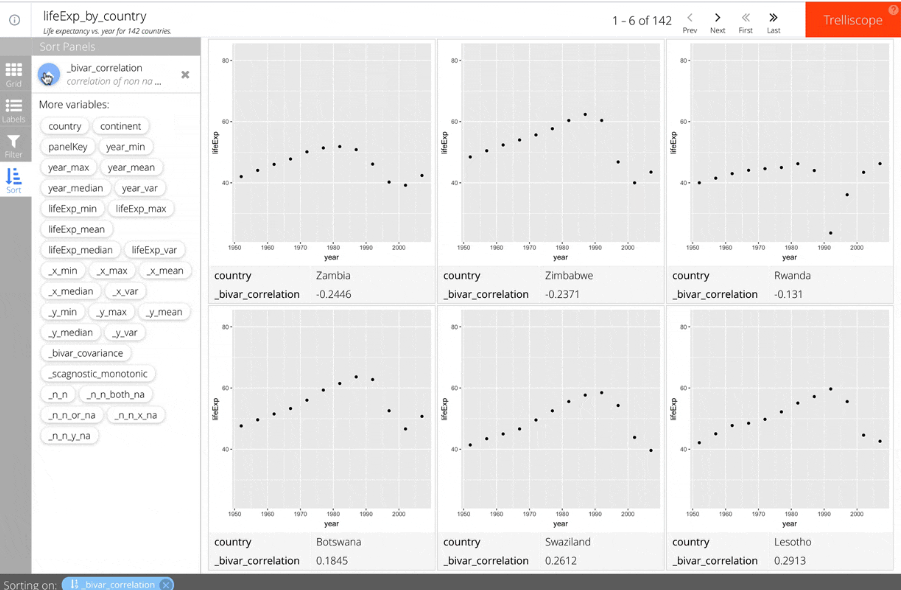
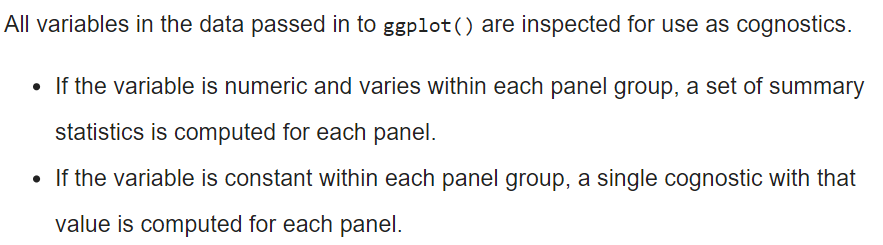
- Context-Based automatic cognostics
- _scagnostic_monotonic, which is a squared measure of the Pearson's correlation coefficient, to see which panels have the most or least linear correlation.
- _scagnostic_monotonic, which is a squared measure of the Pearson's correlation coefficient, to see which panels have the most or least linear correlation.
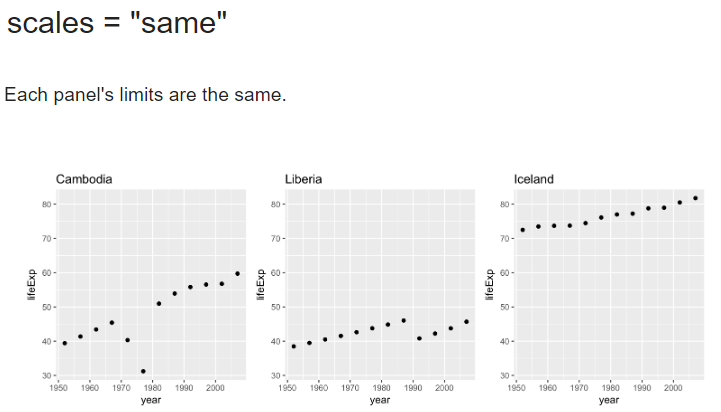
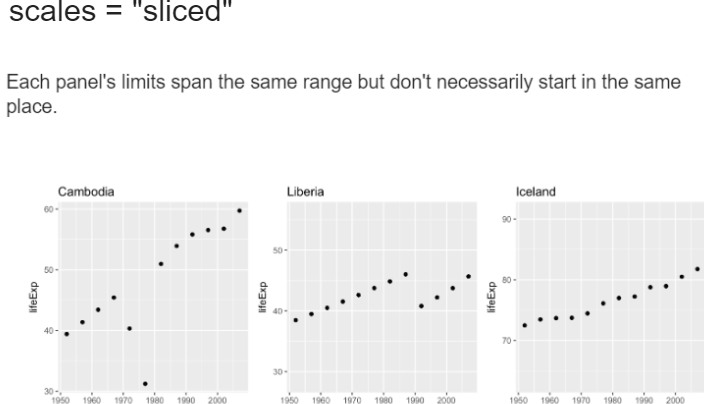
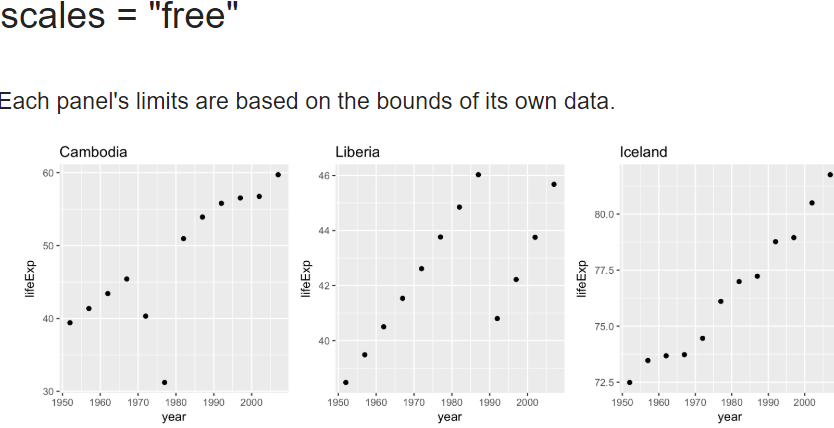
- Axis limits. Axis limits ranges can be controlled with the scales argument. There are three options: same, sliced, and free.
- Using Plotly. This uses the plotly R package to transform your ggplot2 panels into interactive plotly graphics. With hardly any effort we have features like tooltips and zooming for free.
- Adding your own cognostics. There are sometimes on which we believe a specific metric will add a certain value to pur display.
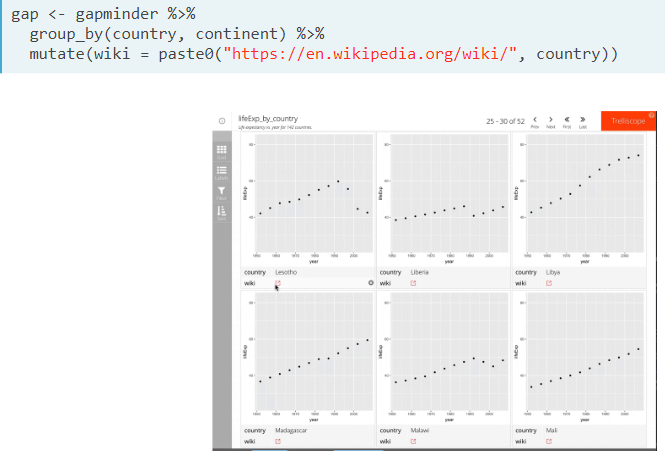
- New variables as cognostics
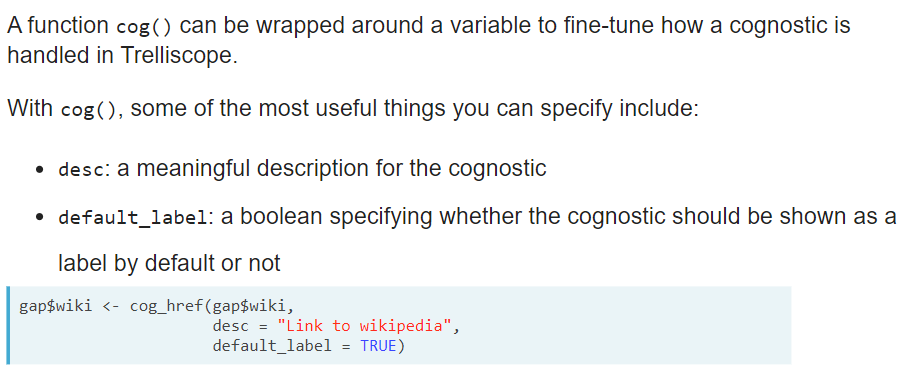
- Hyperlinks as cognostics
- Customizing custom cognostics
- New variables as cognostics
Treslliscope in the Tidyverse
The ggplot2 + trelliscopejs interface is easy to use, but trelliscopejs also provides a faceted plotting mechanism that gives you much more flexibility in what plotting system you use and how to specify cognostics.
- Introduction.
- If we want to visualize stock data, we may want to use a candlestick type. Each candle has the open and close values in the body and high and low values as upper and lower wicks
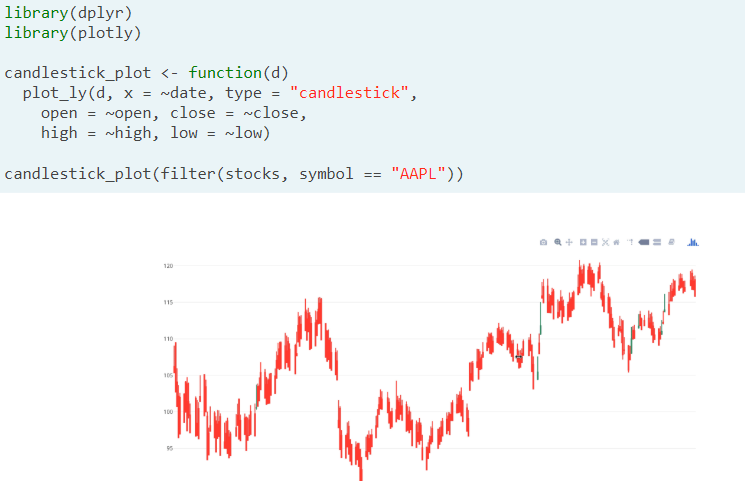
- If the close price is lower than the open price, the body is colored red, otherwise green
- With plotly, we can interactively zoom and pan the chart and we can get additional information on hover
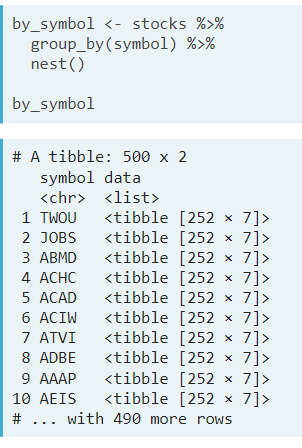
- Nested Data Frames. Now suppose we want to use Trelliscope to make candlestick plots for every stock. To study different subsets of data individually, a common approoach is to group the data by variable(s) that define the subsets and nest the data for the other variables into nested data frames, resulting in a data frame with one row per subset.
- This data structure will form the basis for Tidyverse trelliscope plotting.
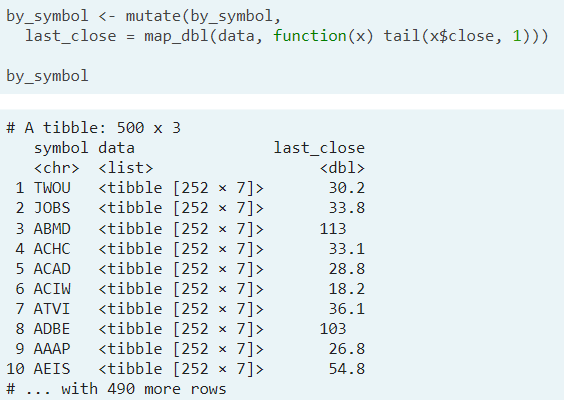
- Computing on Nested Data Frames. To study individual stocks we need to compute on the data for each stock. To compute on nested data frames, we can use a class of functions in the tidyverse 'purr' package, the 'map_*()' family. These apply a user-specified function to each element of the input and return a vector of the same length, with the output type determined by what is specified as the asterisk
One special variable type is a plot column, which can be created using a function, 'map_plot()', provided with TrelliscopeJS. Here we add the panel variable that contains the candlestick plot for each symbol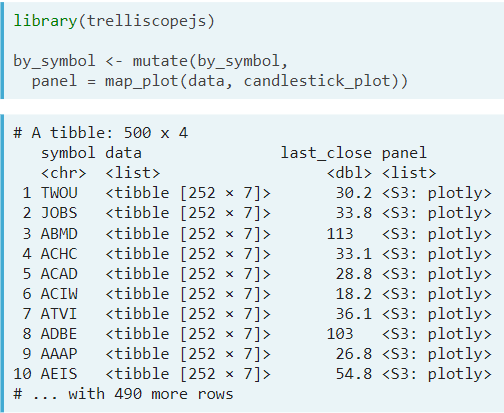
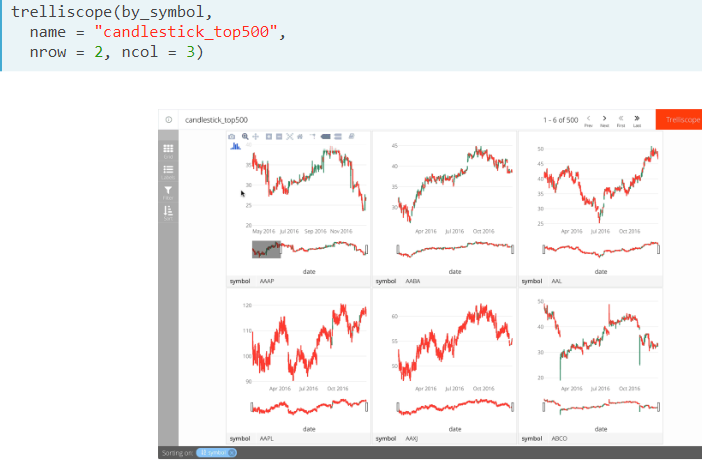
- Creating the display. We can turn a data frame containing a plot column into a trelliscope display by simply passing the data frame to a function, 'trelliscope()'
- This data structure will form the basis for Tidyverse trelliscope plotting.
- If we want to visualize stock data, we may want to use a candlestick type. Each candle has the open and close values in the body and high and low values as upper and lower wicks
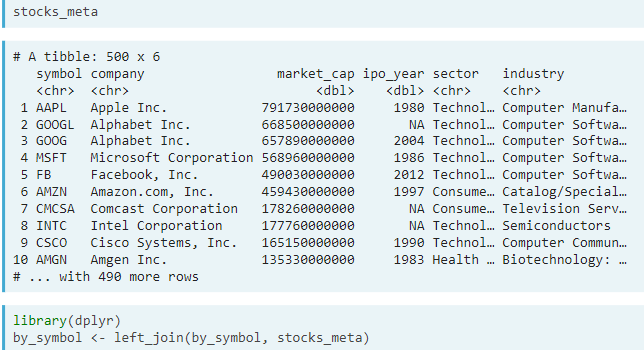
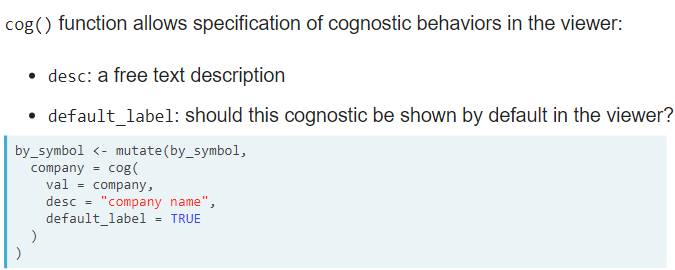
- Cognostics. We can add our own custom cognostics, just as we did before. Adding custom cognostics to Trelliscope displays through the tidyverse approach is as simple as adding new variable to the data frame (ex. the 'last_close' variable we added to our data frame ).
- Adding cognostics to the stock data. By simply joining to our datset. Once we create a new trelliscope display with this data, these variables will automatically be available as cognostics.
- Cognostics as Nested Data Frames. It can often be convenient to compute on nested data to specify multiple cognostics at once.
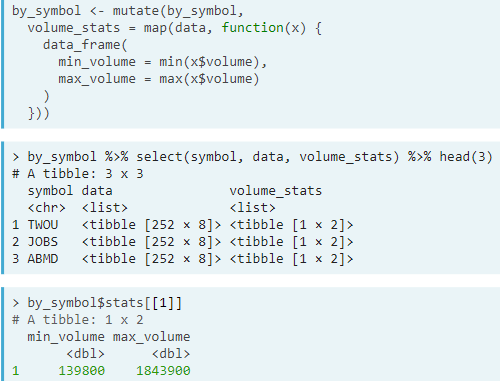
- When Trelliscope finds a variable that contains single-row nested data frames, it will automatically turn these into cognostics as well
- Customizing cognostics. It works the same way as explained in the previous section.
- Adding cognostics to the stock data. By simply joining to our datset. Once we create a new trelliscope display with this data, these variables will automatically be available as cognostics.
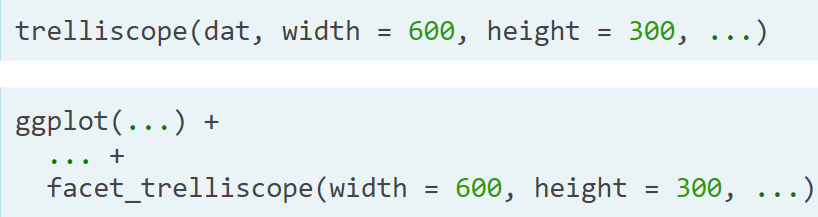
- Trelliscope Options. Let's take a closer look at some of the customizations options provided when creating a Trelliscope display.
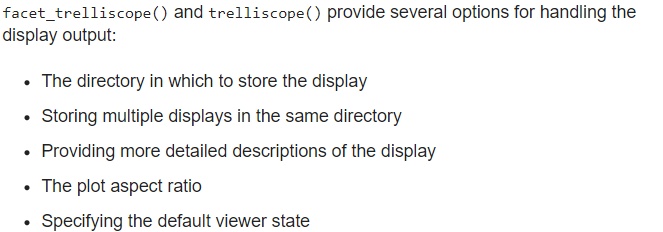
- Specifying the output directory. By default, a trelliscope display is stored as a stand-alone web page stored in a directory. This has benefits, including the ability to easily share the display with others by sending the directory or hosting the directory on the web through various services such as github pages
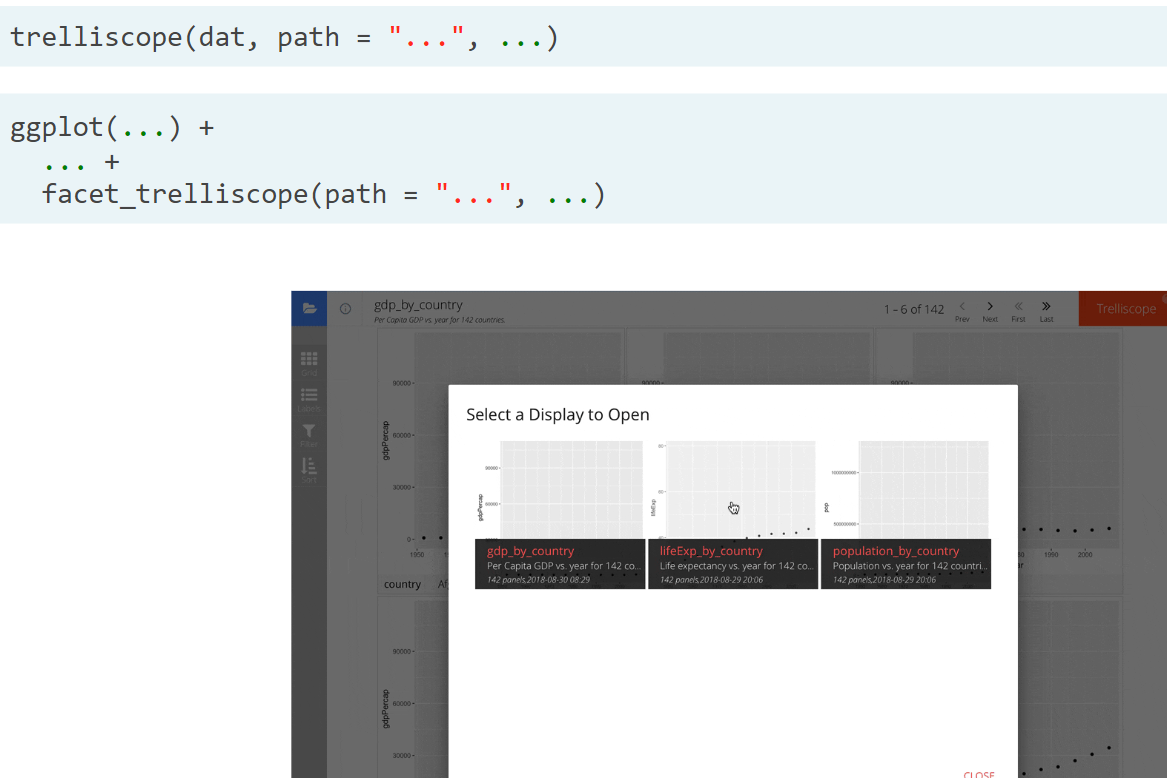
- If no 'path' is specified, the display is stored in a temporary directory.
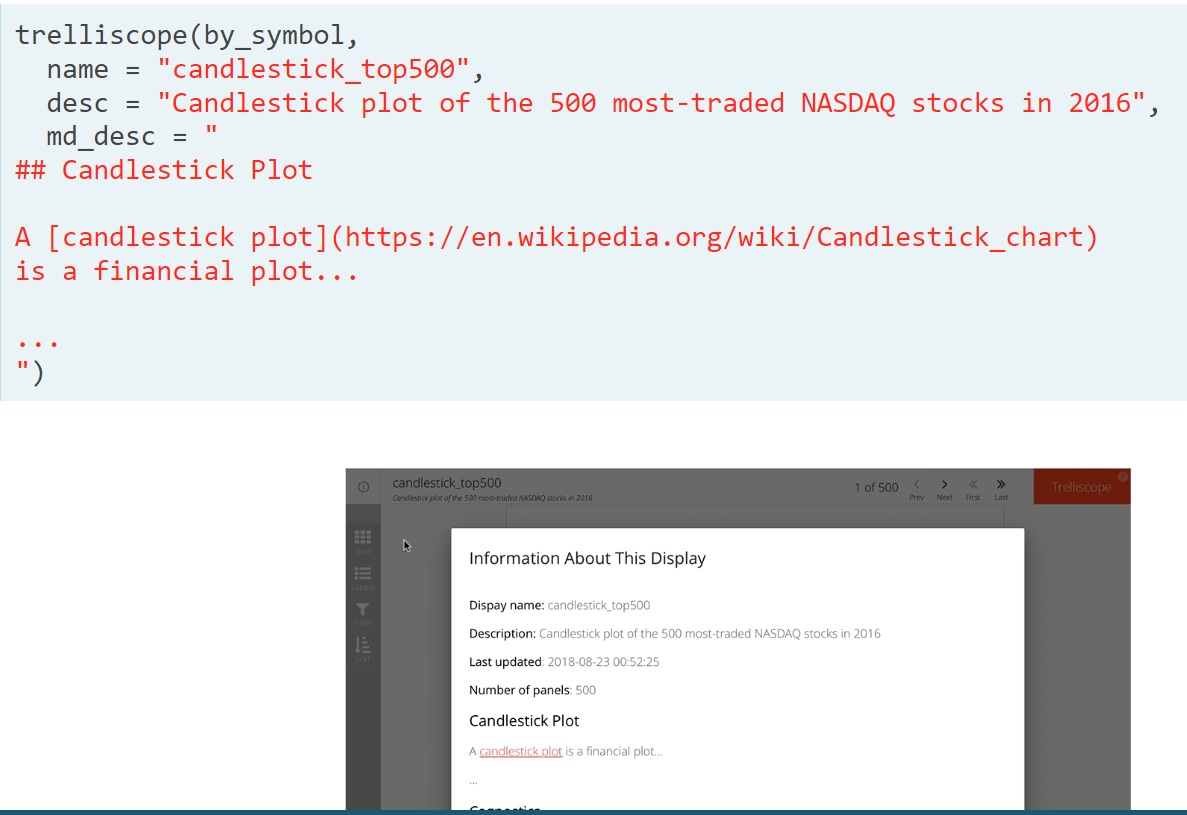
- Detailed Description.
- Plot aspect ratio.
- Specifying the output directory. By default, a trelliscope display is stored as a stand-alone web page stored in a directory. This has benefits, including the ability to easily share the display with others by sending the directory or hosting the directory on the web through various services such as github pages
- Visualizing databases of images. A special but very useful use case of Trelliscope is visualizing large collections of image data. The Trelliscope viewer is naturally a viewer for collections of images
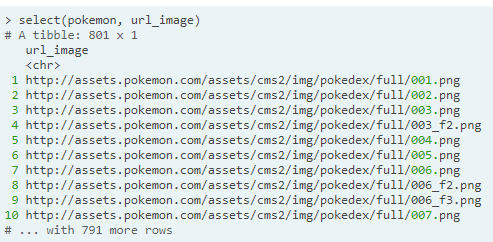
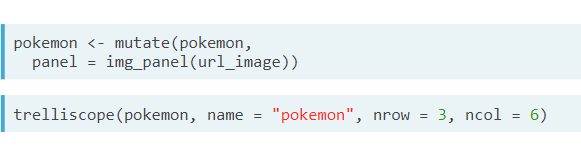
- img_panel(). To specify that a variable containing a URL pointing to an image should be used as the image for each panel in a display, we simply wrao the variable with a function 'image_panel()'
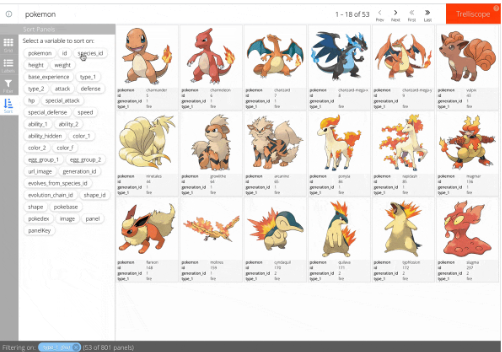
- Local images. The images must be placed somewhere in the directory that your trelliscope display will be placed in, and then a relative path must be supplied to a functiton img_panel_local()
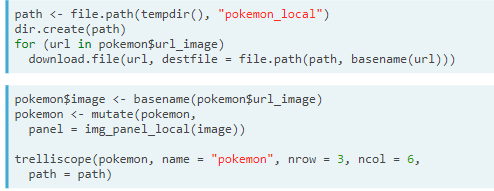
- img_panel(). To specify that a variable containing a URL pointing to an image should be used as the image for each panel in a display, we simply wrao the variable with a function 'image_panel()'
Resources
- Documentation: https://hafen.github.io/trelliscopejs/
- Github: https://github.com/hafen/trelliscopejs
- Blog: http://ryanhafen.com/blog/
Comments