R: Unsupervised learning
Types of machine learning
Unsupervised learning. Finding structure in unlabeled data.
Supervised learning. Making predictions (like regression or classification) based on labeled data.
Reinforcement learning. The computer learns from feedback by operating in a real or syntethic environment
For a nice article regarding PCA, look here
Unsupervised learning
Finding homogeneous subgroups within larger group.
- Clustering
Finding patterns in the featured of the data
- Dimensionality reduction. It is a method to decrease the number of features that describe an observation while mantaining the maximum information content under the constraints of lower dimensionality.
- Find patterns in the features of data
- Visualization of high dimensional data
- Pre-processing before supervised learning
Challenges and benefits
- No single goal of analysis
- Requires more creativity
- There are much more unlabeled data available than cleanly labeled data
K-means
https://1426897.site123.me/data-mining/cluster-analysis-in-r
Hierarchical clustering
https://1426897.site123.me/data-mining/cluster-analysis-in-r
Dimensionality reduction
A popular method is Principal Component Analysis (PCA)
Three goals when finding lower dimensional representation of features:
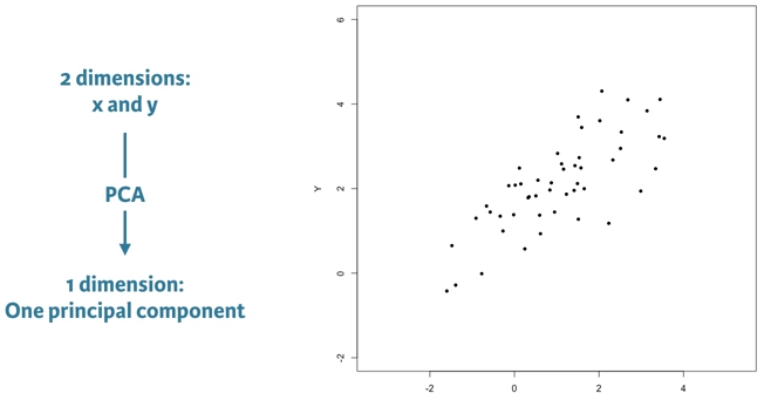
- Find linear combination of variables to create principal components
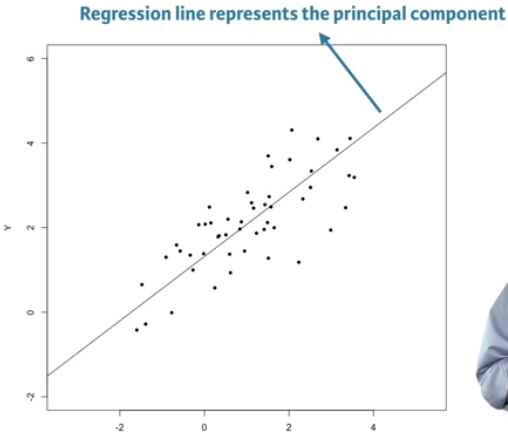
- Maintain most variance in the data
- Principal components are uncorrelated (orthogonal to each other)
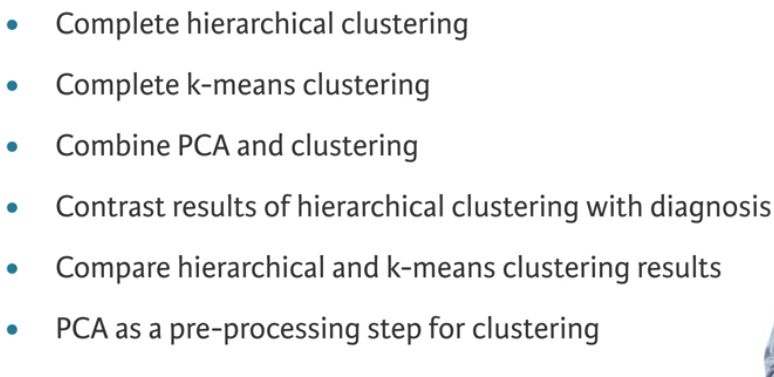
- PCA intuition
 |  |  |
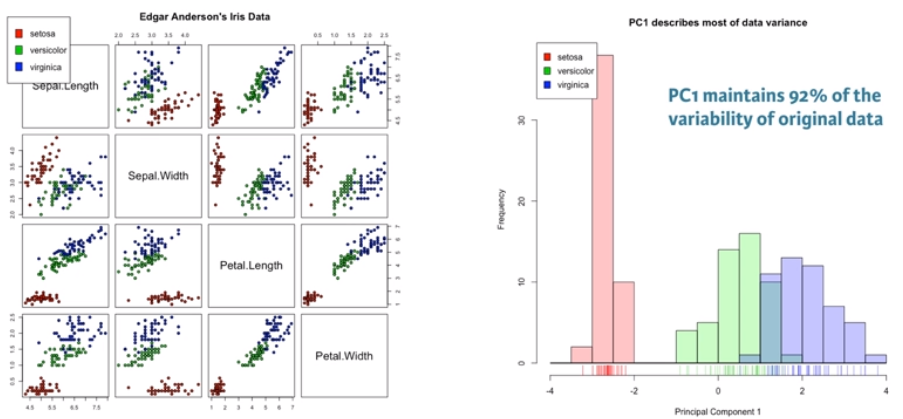
The next shows the way to visualize the iris data set using all its features vs the first principal component
- In R
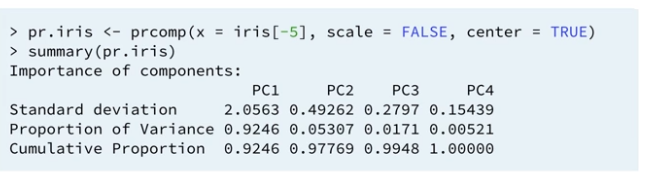
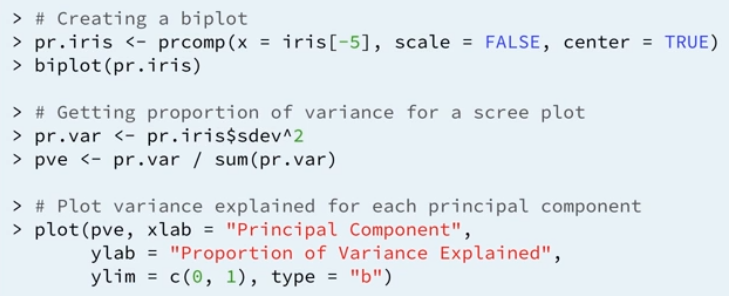
- Visualizing and interpreting PCA results
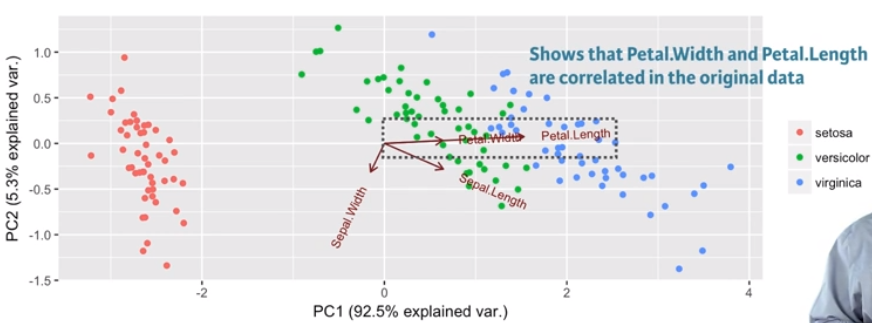
- Biplot. This plot shows all of the original observations as points plotted in the first two principal components. It also shows the original features as vectors onto the first two principal components (PCs are a linear combination of the original features, each feature with a corresponding scalar in the linear combination; these scalars, compared among features, gives the degree of each feature in the biplot)
- Scree plot. It shows the proportion of variance explained by each principal component, or the acumulated one.
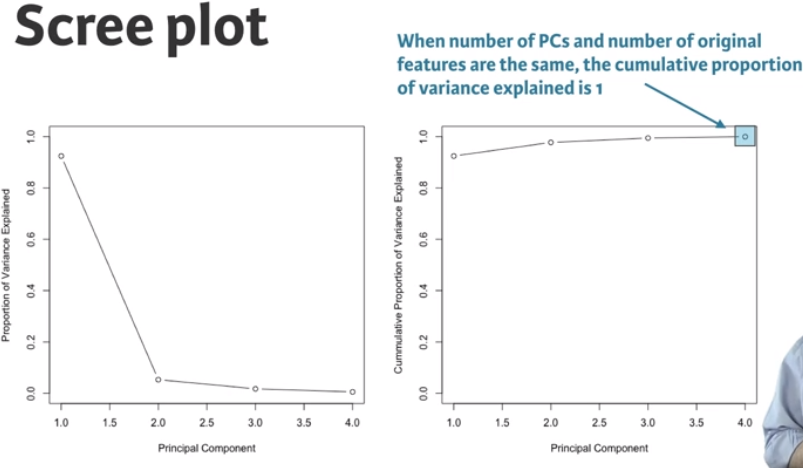
- In R.
- Biplot. This plot shows all of the original observations as points plotted in the first two principal components. It also shows the original features as vectors onto the first two principal components (PCs are a linear combination of the original features, each feature with a corresponding scalar in the linear combination; these scalars, compared among features, gives the degree of each feature in the biplot)
- Practical issues with PCA
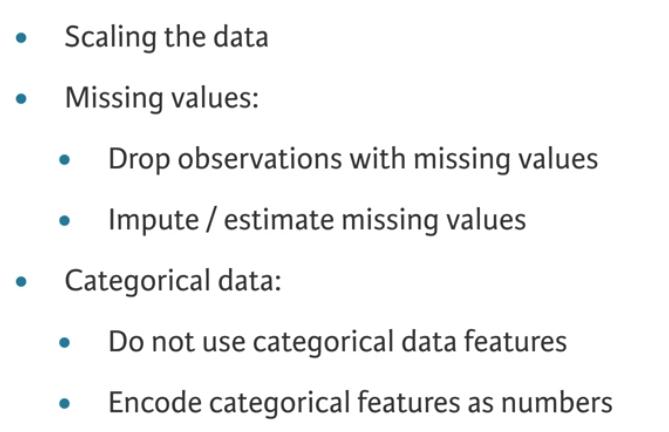
- Scaling the data
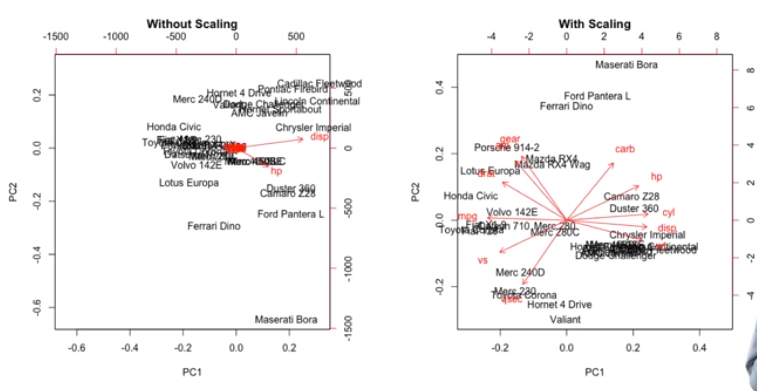
- Scaling the data
Case Study
The first steps of this case study are: Download data and prepare data for modeling, Exploratory data analysis, and then starting by performing PCA and interpreting the results. Next: